Diagnostic
criteria and differential diagnosis
Disease
Modifying/Relapse prevention
Comparison
|
|
MS |
NMO |
MOG |
|
ADEM |
+ |
+ |
+++ |
|
Tumefactive
lesions |
+ |
+ |
+ |
|
Bilateral optic
neuritis |
+ |
+++ |
++ |
|
Frequent optic
neuritis |
+ |
++ |
+++ |
|
Papilitis |
- |
- |
++ |
|
Brainstem lesions |
++ |
+ |
+ |
|
Long. Extensive ON |
- |
++ |
++ |
|
LETM |
+ |
+++ |
+ |
|
Partial cord
syndrome |
+++ |
+ |
++ |
|
‘Devics’/opticospinal |
+ |
++ |
++ |
|
Area postrema syndrome |
- |
++ |
_ |
|
Hypothalamic
syndrome |
- |
+ |
- |
Courtesy of Prof S Broadley, QNS meeting 2021
·
Epidemiology
• Incidence ~ 0.05-0.4/100,000
• Prevalence between 0.05 and 4.4/100,000
o 1/25,000 Caucasian
o 1/20,000 black americans
• Female:Male 3:1
• Median age of onset – Mid 30’s
• 10% of patients younger than 18yrs
• Familial form accounts for 3%
• Genes associated with increased risk DPB1*0501 in Asians and DRB1*0301 in Caucasians
• Accounts for a greater proportion of demyelinating disease in non-caucasian populations
• Prevalence in first episode optic neuritis – 3-5%, recurrent optic neuritis – 10-20%
Pathogenesis
• Astrocytes thought to be target of destruction (compared to oligodendrocytes in MS)
• Increased GFAP in CSF - ?marker of cellular destruction
• Increase in CSF IL-6, in contrast to MS in which TNF-alpha elevated
• ?hence more of a Th2 disease compared to MS being Th1
•
• Aquaporin
• Water channel
• Expressed on astrocyte foot processes around capillaries
Clinical Features
Presenting features
• Optic neuritis – 45%
o Bilateral 20% of these
• Myelitis - 45%
• Optic neuritis and myelitis – 10%
Optic neuritis
•
• More severe than MS – 80% have 20/200 or worse, no light perception in 30%. (c.f. MS 36% and 7%)
• In patients with diagnosis of NMO for 5+ years - ~50% have 20/200 vision or worse on one eye and 20% have this in both eyes (c.f. MS 4% and 2%)
• About 30% have vision of 20/200 or worse after first episode
• Eye pain common but maybe less than MS optic neuritis
• Optic disc oedema is seen in less than 50% (maybe as low as 5%)
• Visual field defects broadly similar to MS
• More often bilateral
• More often recurrent (double the relapse rate)
Myelopathy
• Most is long segment
• 17% short segment
• Often central cord
Intractable Nausea and Vomiting
Eye movement abnormalities
• Usually in association with brainstem lesions
• Upbeat, downbeat or mixed horizontal-torsional nystagmus
• Wall eyed bilateral INO
• Opsoclonus
• Diplopia and oscillopsia reported
·
Progression
• If a single clinic event with positive antibody referred to as “NMO spectrum disorder”
• 55% of patients of NMO spectrum disorder relapsed with second episode within one year
• If presenting with optic neuritis there is an average 2year lag before the development of myelitis (and hence meeting disease definition)
• In 20% of patients the disease may be monophasic, without relapse.
Diagnosis
Anti-Aquaporin 4 antibodies
• Accuracy of test depends on assay used:
o ELISA Sn 60%
o Cell based assay Sn 73%
o FACS SN 76%
o All have specificity approaching 100%
• In some cases is detectable in CSF but not serum
• It remains debateable whether antibody levels correlate with disease activity
OCT
• RNFL reduction 30-40um avg (c.f. 10-20um in MS)
• RNFL loss evenly distributed around peripapillary circumference (compared to MS which is usually more temporal)
VEP
• Many patients with positive antibodies but no history of optic neuritis have ‘sub-clinically’ abnormal VEP.
Other
• Other auto-immune markers are not infrequently raised in NMO (e.g. SLE markers), this is thought to be generally non-specific
CSF
• Often a high level of white cells – predominantly neutrophils and eosinophils
• Oligoclonal bands in 30%
Imaging
• MRI-orbits
o Typical changes of optic neuritis (optic nerve enlargement, increased T2 signal, enhancement.
o Often more extensive changes than MS, more frequently involving the optic chiasm
•
• MRI-Brain
o 10% have abnormalities consistent with MS, most have non-specific abnormalities.
o Brainstem (caudal medulla) and hypothalamic lesions more common
o Cerebral - Usually periventricular and midline, cloud like enhancing lesions can occur
o Grey matter lesions can occur
• MRI -Spine
o Lesions usually 3 or more spinal segments long
o Centrally located
o Cause cord expansion
o Enhance with gadolinium
Below figures from: Clarke L, Arnett S, Broadley SA et al. MRI Patterns Distinguish AQP4 Antibody Positive Neuromyelitis Optica Spectrum Disorder From Multiple Sclerosis. Front Neurol. 2021 Sep 9;12:722237. doi:
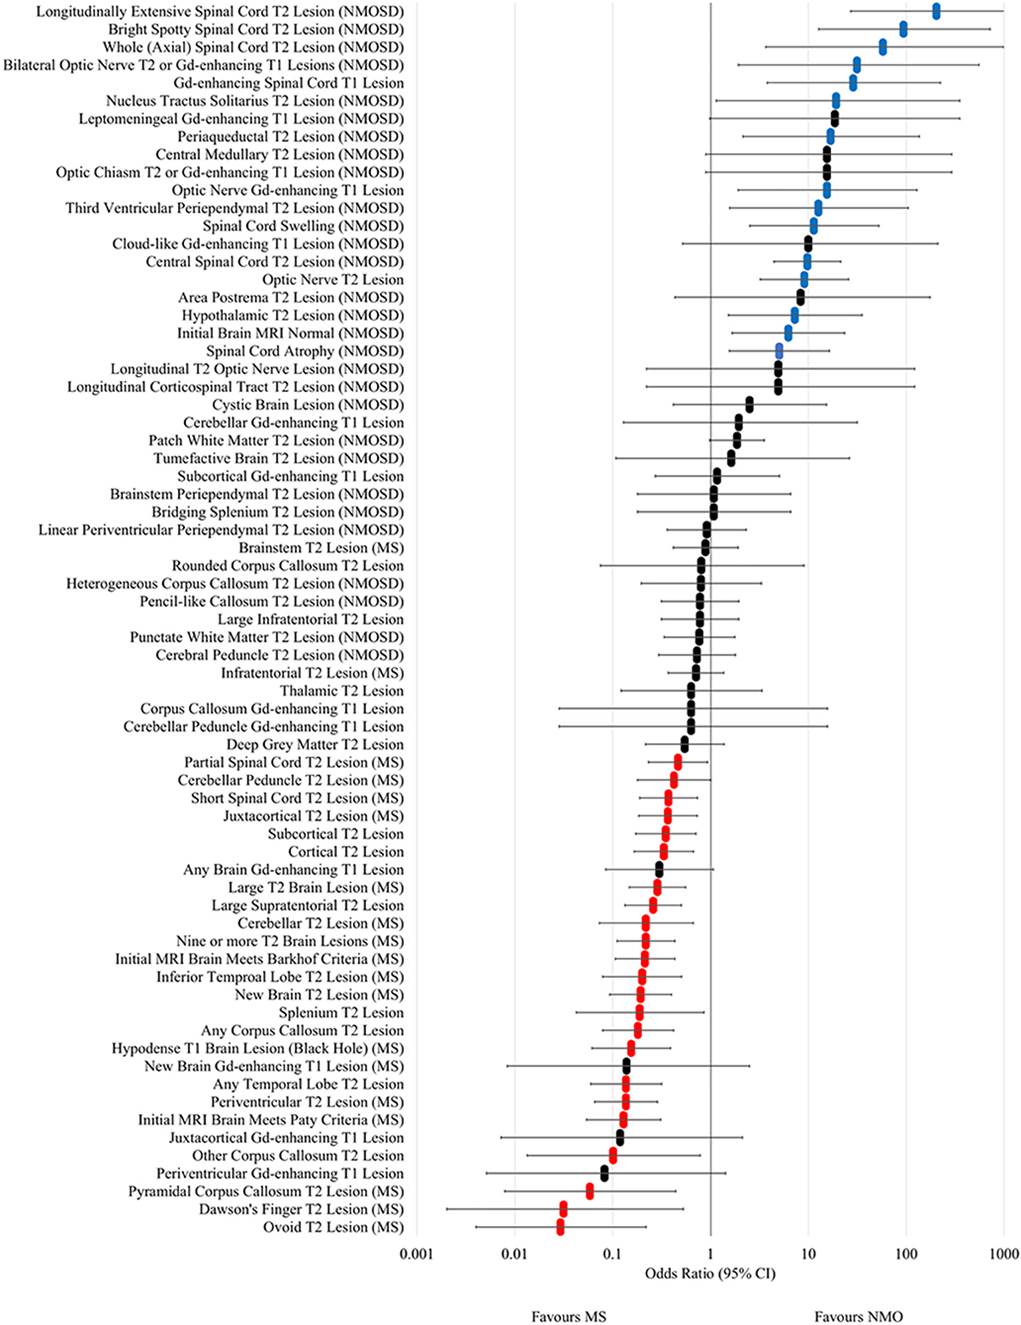
Figure 4. Forest plot of odds ratios for lesion occurrence
in NMOSD and multiple sclerosis. OR >1 favour NMOSD and OR <1 favour
multiple sclerosis. Error bars indicate 95% confidence intervals. Lesions
significantly associated with NMOSD are highlighted in blue and those
associated with multiple sclerosis are highlighted in red.
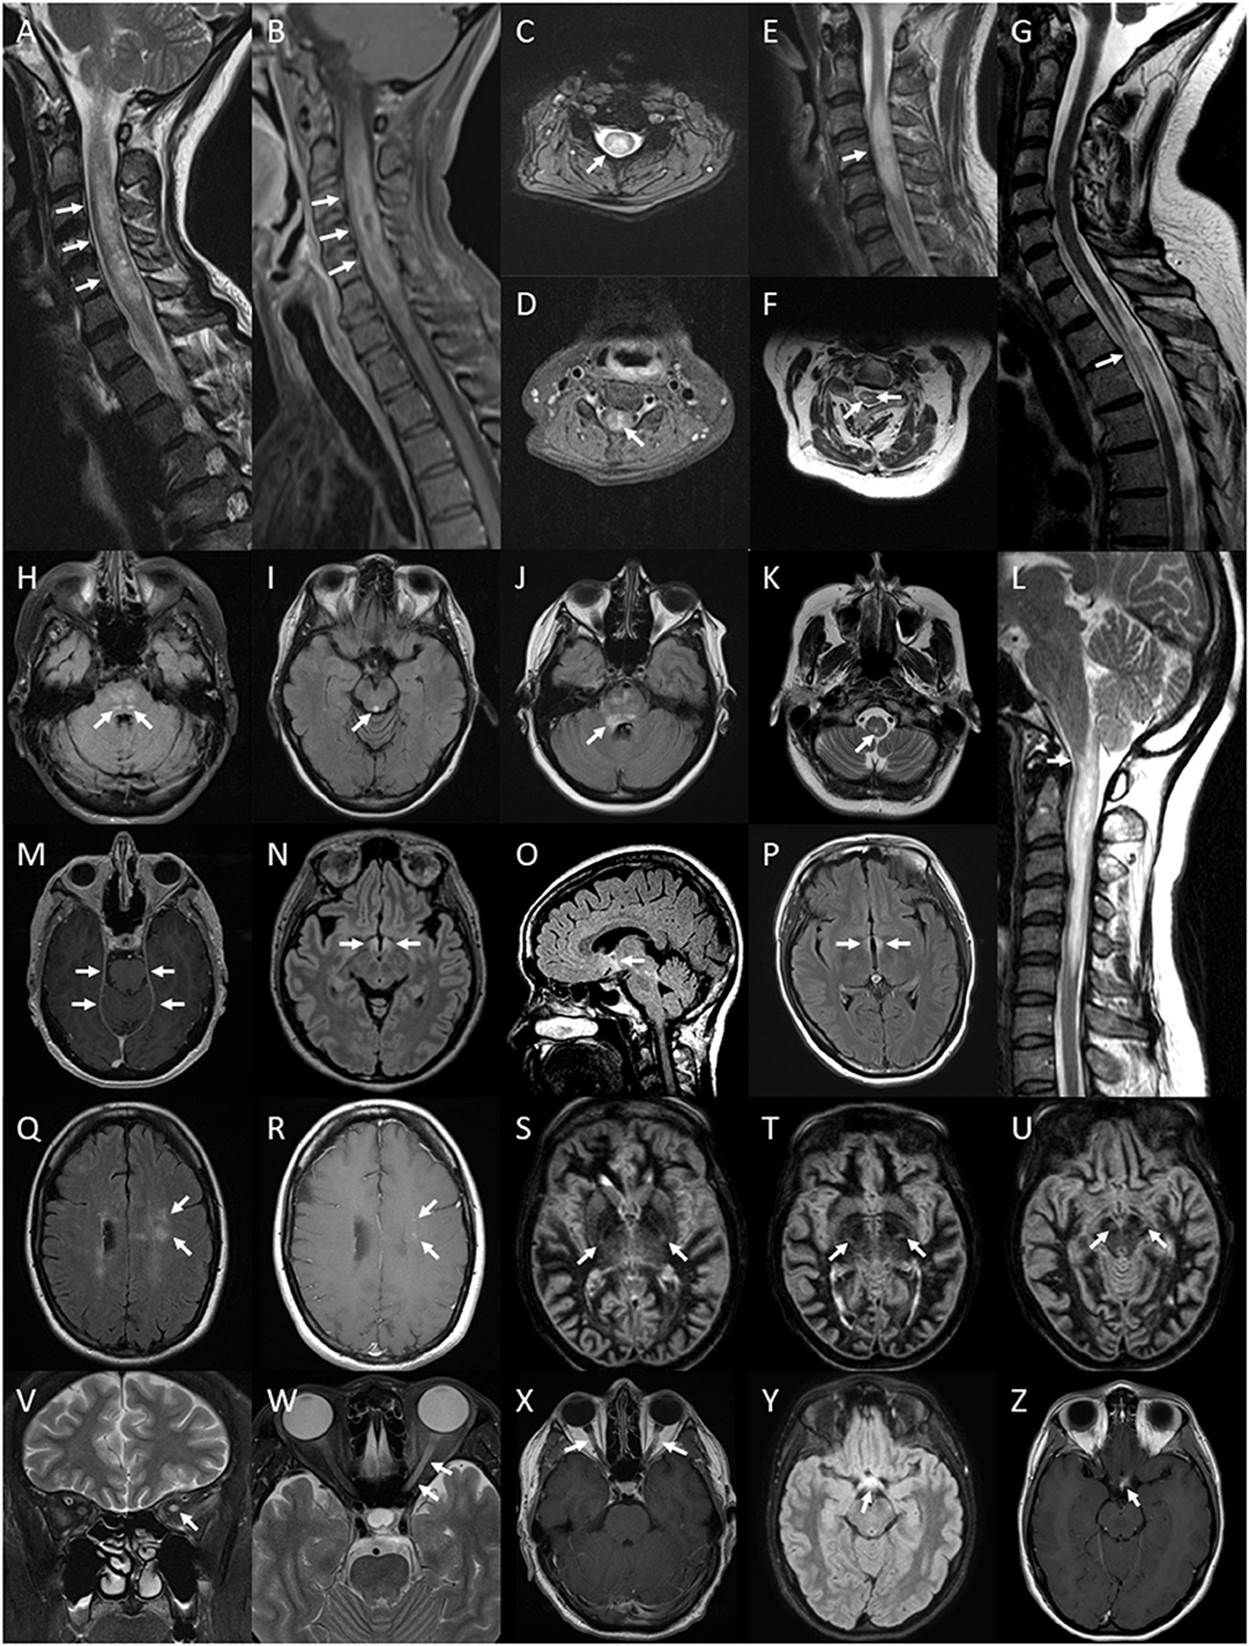
Figure 5. Lesions of the spinal cord, brain and optic
nerve associated with or exclusively seen in NMOSD. Spinal cord lesions:
longitudinally extensive spinal cord lesion (arrows) seen on T2 sagittal image
of the cervical cord (A), peripheral Gd-enhancing lesion (arrows) seen on T1 sagittal
image of the same lesion (B), central cord lesion (arrow) on T2 axial image at the level
of C4 from the same lesion (C) and central Gd-enhancement (arrow) on T1 axial image in
the same region (D); swelling (arrow) of a high signal lesion on T2
sagittal image of the cervical region (E); bright spotty cord lesions (arrows) on axialT2 image of the
cervical region (F); spinal cord atrophy with myelomalacia (arrow) on
sagittal T2 image of the cervico-thoracic region (G); Brainstem lesions: bilateral nucleus tractus solitarius high
signal lesions (arrows) on axial FLAIR image through the pons (H); periaqueductal high signal lesion (arrow) on axial FLAIR
image through the midbrain (I); high signal FLAIR lesion involving the floor of the fourth
ventricle on axial FLAIR imaging at the level of the pons (J); central medullary lesion (arrow) on T2 axial image of the
medulla (K) and sagittal T2 image of high cervical cord
lesion showing extension into the medulla (L). Leptomeningeal enhancement of the tent (arrows) on axial
gadolinium enhanced T1 image at the level of the midbrain (M). Brain FLAIR lesions: hypothalamic high signal lesion
(arrows) on axial image (N) and midline sagittal image (O); high signal lesion involving the walls of the third
ventricle (arrows) on axial image (P). Cloud-like Gd-enhancing lesions (arrows) shown on axial
FLAIR image (Q) and Gd-enhanced T1 image (R). Bilateral longitudinally extensive cortico-spinal tract
lesions (arrows) seen on sequential axial DIR images through the basal ganglia
and midbrain (S–U). Optic nerve lesions: high signal lesion of the
left optic nerve (arrow) on coronal T2 image of the orbits (V); longitudinally extensive high signal lesion of the left
optic nerve (arrows) on axial T2 image of the orbits (W); bilaterally Gd-enhancing lesions of the optic nerves
(arrows) on axial Gd-enhanced T1 image of the orbits (X); optic chiasm lesion (arrow) on axial Flair image (Y) and Gd-enhanced T1 image (Z).
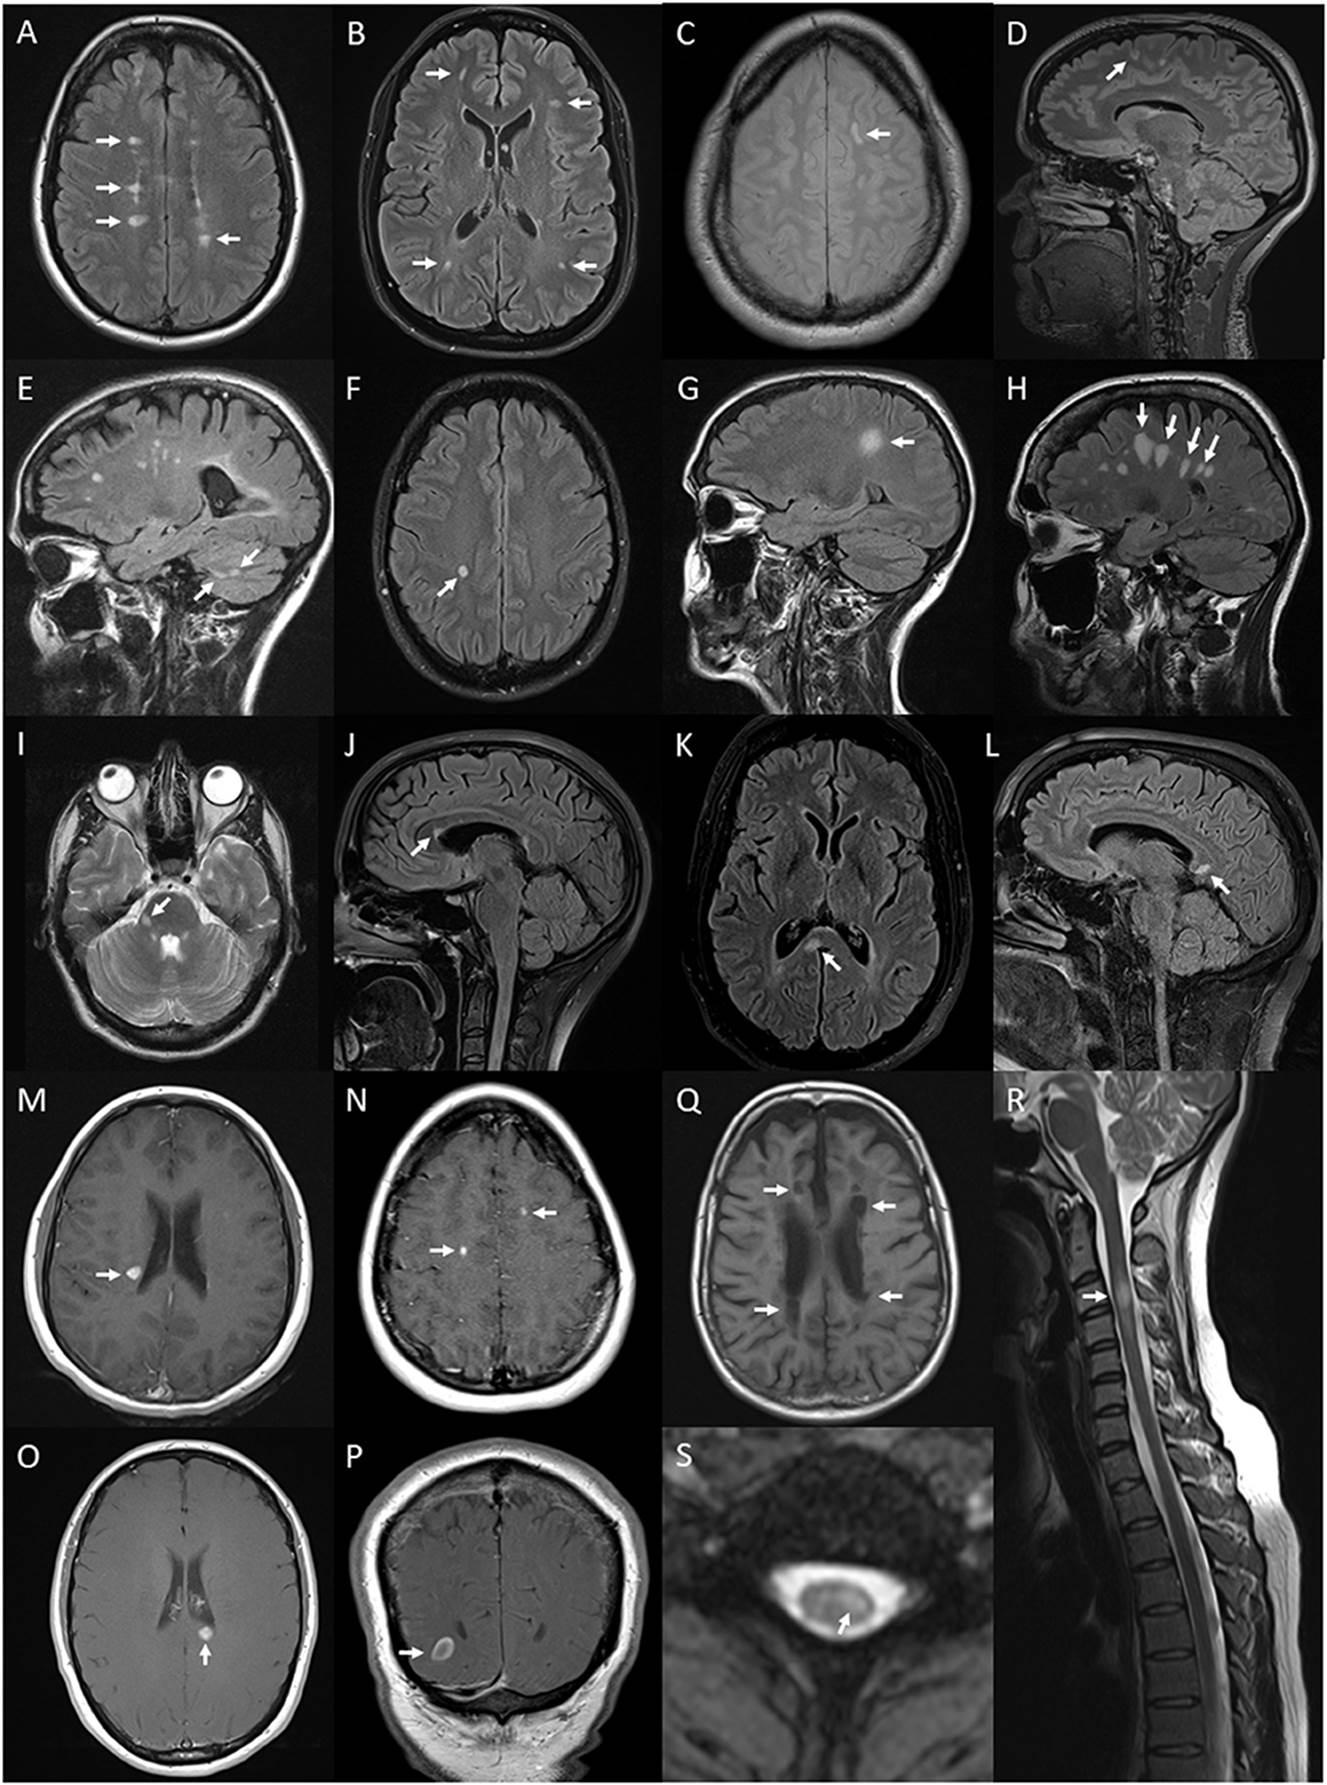
Figure 6. Lesions and features on MRI of brain and spinal
cord associated with multiple sclerosis: periventricular hyperintense T2 white
matter lesions (arrows) on axial FLAIR image of the brain (A); subcortical T2 white matter lesions (arrows) on axial FLAIR
image of the brain (B); juxtacortical hyperintense T2 white matter lesion (arrow)
on axial proton density image of the brain (C); cortical hyperintense T2 lesion (arrow) on sagittal FLAIR
image of the brain (D); cerebellar hyperintense T2 lesions (arrows) on sagittal
FLAIR image of the brain (E); ovoid hyperintense T2 periventricular lesion (arrow) on
axial FLAIR image of the brain (F); large supratentorial T2 lesion (arrow) on sagittal FLAIR
image of the brain (G); Dawson's finger lesions (arrows) on sagittal FLAIR image of
the brain (H); right cerebellar peduncle hyperintense T2 lesion
(arrow) on axial T2 image of the brain (I); pyramidal corpus callosum hyperintense T2 lesion (arrow) on
sagittal FLAIR image of the brain (J); splenium hyperintense T2 lesion (arrow) on axial (K) and sagittal (L) FLAIR images of the brain; Gd-enhancing T1 lesions of
periventricular (arrow) (M), juxtacortical (arrows) (N), splenium (arrow) (O) regions on axial T1 images of the brain and
ring-enhancing lesion (arrow) on coronal T1 image of the brain (P); hypointense T1 (black hole) lesions (arrows) on axial T1
image of the brain (Q); short segment C3 T2 lesion (arrow) on sagittal T2 image of
the cervical spinal cord (R); and hyperintense T2 partial cord lesion (arrow) on axial T2
image of the cervical spinal cord (S).
Diagnostic criteria and differential diagnosis
• At least one attack of:
• Optic neuritis
• AND
• Acute myelitis
• At least 2 of three
• Longitudinally extensive lesion (3 or more vertebral segements)
• Brain MRI – normal or lesions not meeting diagnostic criteria for MS.
• NMO (Aquaporin 4) IgG antibody positive
•
DDx
• Optic neuritis
o DDx: See the full list of optic neuropathies (ref), CRION (Chronic Relapsing Inflammatory Optic Neuritis) may be especially difficult to differentiate.
• Who to test for antibodies (suggested criteria):
o Worst VA light perception or less
o VA at recovery worse than 20/50
o Bilateral optic neuritis
o Recurrent optic neuritis
o Systemic autoimmune disease
o OCT RNFL thickness <70um (avg.)
• LETM
o DDX
o Sarcoidosis
Treatment
Acute exacerbation
• High dose IV steroids first line
o (1g daily for 3-5 days)
• Oral steroids – Continued oral steroids over 2-6months has been recommended to prevent rebound or relapse (e.g. 60mg/day wean to 10mg over 3 months then reassess)
• Plasma exchange
o Appears to improve clinical outcomes if steroids fail.
o Should be initiated rapidly (within 5 days if no response 7-10days if partial response)
• IVIG – sometimes used. No good data.
•
Disease Modifying/Relapse prevention
• Low dose steroids
o Suggested to continue while other agents introduced (~2-6months)
o Start 1mg/kg, wean 5mg/month
o ?NMO often appears quite steroid responsive
o ?Some patients may need to remain on small dose long term
• Azthioprine (+/- steroids)
o Some small trials showing reduced relapse rate (Class IV evidence)
o First choice steroid sparing agent (2.3-4mg/kg)
o See Evidence below
• Methotrexate
o 15-25mg once weekly
o Class IV evidence from one trial.
• Mycophenolate mofetil
o Small trial indicated some benefit (Class IV evidence)
o See evidence below
• Rituximab
o Trial of 8 patients showed mixed results
o In another trial 2 patients had a significant relapses after treatment ?effect of the medication
o European guidelines suggest use as first line agent
o British guidelines suggest reserve as a second line agent – i.e. no response to PEX or severe, rapid relapse.
o See evidence below
• Eculiziumab
o anti-complement antibody – excellent results
o AE: meningococcal meningitis 1-2/1000
• Cyclophosphamide
o A few single case reports of benefit
• Mitoxantrone
o Some small trials showing benefit
• Other possible agents:
o Case reports of Glatiramer being used as prevention with some success.
Evidence
• Poupart J et al. 136 pts rituximab vs mycophenolate vs azathioprine - relapse rate was low with all three (28% over 3 years)- but lowest with rituximab then azathioprine then mycophenolate.
Avoid
• The following MS treatments have been associated with a worsening of disease:
o IFN-Beta – case reports suggesting worsening of disease
o Fingolimod
o Natulizumab
•
Epidemiology
• More even sex ratio c.f. NMO, MS – 58% female
• 2 age peaks:
o Paeds - 10yrs old
o Adults – 35yrs
Diagnosis
• MOG ELISA – very unreliable – many false positives
Radiographics article
C.f. NMO
- more thoracic and lumbar lesions
- less painful tonic spasms
Antibodies can remain positive or be transient
Transient antibodies may indicate ADEM phenotype rather than chronic disease
Treatment
• IV Methylprednisolone
o More aggressive course – 3-7days
• Oral steroids
o Prolonged taper 3-12 months (e.g. 60mg daily reducing to 10mg over 3 months, may need small ongoing wean 12 months)
• Plasma exchange
o If steroids ineffective
• Steroid sparing agents
o Mycophonolate (or azathioprine, methotrexate, cyclosporin)
o IVIG can be considered as a bridge therapy
• Rituximab
o Generally considered 2nd line, however many centres using first line with steroids
• Tocilizumabl
Anecdotal experience – IVIG may be better than steroids/azathioprine
Ophthalmology 2018 (Pittock)
Imaging
• Radial enhancement radiating out from ventricles
• Multiple possible presentations
• Disc swelling without optic neuritis
• Very responsive to steroids
•